
A little background, to start of this article, we first need to know about sentiment analysis and their impact on the world around us now and in the future. How brands use sentiment Analysis around us and how strong social media is in this context, more specifically, Twitter. In this article, we are going to be looking at how the trending topics on twitter can affect a particular individual, a brand or even an industry. We did a Whole Piece on Sentiment Analysis, you can read all about it here.
This article focuses primarily on the current events that are to be trending on twitter, more specifically a certain keyword a user uses that might have an effect on business brands and analyzing the tweets in real time regarding mentioned subject and how the people have their opinion on it. This analyzation will be in a final product of a user-friendly dashboard that could be helpful to the general public, brands etc.

The system aims to cover as many issues as possible, that is the reason a specific domain is not specified. As shown in the diagram below, the entirety of the process begins with the user typing in a topic of their desire or search for a particular entity. Data is then extracted from the social media (Twitter). This process is the longest (duration-wise) as it is difficult to get data. The data is then mined and analyzed into displaying the patterns of opinion on the subject. The process, Sentiment analysis, is used to analyzing the textual form of the comments from the people of the internet. The emoticons are deciphered as well and hence display the sentiment across them (like a smiley means happy etc.).
The data acquired is then visualized and displayed to the user in a manner such that every piece of information is being shown in a manner such that the user is able to understand.
Requirements for the System
Python IDE (PyCharm was used for this)
Google Account
Tableau Public Account
The Libraries used
The following libraries are used in this entire process:
import os
import string
#import stopwords as stopwords
import tweepy as tw
from tweepy import Stream
from tweepy import OAuthHandler
from tweepy.streaming import StreamListener
import gspread
from oauth2client.service_account import ServiceAccountCredentials
import pandas as pd
from tqdm import tqdm
import time
import re
import preprocessor as p
from nltk.tokenize import word_tokenize
from textblob import TextBlob
from nltk.corpus import stopwords
import pygsheets
from tkinter import *
from tkinter.ttk import *
import pycountry
from tkinter import messagebox
from tkinter import ttk
import webbrowser
Tweepy
The Tweepy is a python module which is an integral part of this project. It acts a python wrapper that allows us to stream and use data directly from Twitter API.
PygSheets
Pygsheets is an intuitive simple python library which enables Python users to access their google sheets through Google Sheets API v4.
Pandas
Pandas is a fast, flexible and open source tool built on top of python that is used for data analysis and manipulation. We will be using it here to create datframes.
Tkinter
Tkinter is said to be Python’s default GUI package. It comes pre-installed with python, so you do not have to install it manually. It is the most commonly used GUI in python.
Pre-processor
This is a library found in python specifically for pre-processing tweets extracted. This library cleans tweets easily as well as parse and tokenize the data extracted.
TextBlob
TextBlob is a library in python that is used to automate processing data in textual form. It provides a common API for common NLP tasks such as POS tagging, sentiment analysis etc. In this system, textblob is used measure a tweets polarity in order to determine the sentiment of the tweet which ranges from -1 (negative) to +1(positive. Subjectivity of a tweet is also measured using textblob.
NLTK
One of the most vital libraries to use in this system will have to be he nltk (Natural language toolkit). NLTK libraries provide developers a way out to let their machines interact with human language data. The prime reason for the popularity of nltk is it’s easy to use interface as well as its versatility across platforms. NLTK further provides functions that can help us to pre-process data with functions such as word_tokenize() where words are split into tokens and analysed sentimentally. It also has various other functionalities so that the developer can interact and understand human language data via their machine.
Tableau
Tableau is an interactive visualization software that is primarily used for business intelligence in order to have a better understanding of the data. In this system, we are using tableau live integrated with tableau public connected to google sheets. So, any time there is a change into the google sheets from our system, the change in data will automatically be reflected in Tableau as well.
Regular Expression
Regular expression is a vital part of text analysis. It is essentially used in automatic algorithms since its main specification is that it matches a string, or a set of strings specified prior.
Others
Other libraries such as time and pycountry was used for an efficient performance of the system. Time library was used as the system is made to sleep in several occasions in order for smooth concurrency. Pycountry was used to determine locations for visualisation purposes.
The Main Code
Before we begin, you will need to be a twitter developer and get some credentials. It’s a simple process. I will link Shivani Dandir’s article here so just follow the first few steps until you get your Consumer keys and Access keys.
Extracting Data from Twitter using Python | by Shivani Dandir | Towards Data Science
Using Tweepy to access the Twitter API:
#Twitter credentials for the app
consumer_key = 'consumer_key'
consumer_secret = 'consumer_secret'
access_key= 'access_key'
access_secret = 'access_secret'

#pass twitter credentials to tweepy
auth = tw.OAuthHandler(consumer_key, consumer_secret)
auth.set_access_token(access_key, access_secret)
api = tw.API(auth)
This code will take your consumer key that you are going to get from your twitter API and extract tweets.
Define all emoticons to help us clean data
Since the data is extracted in real-time, factors such as outliers do not exist as there is no range of any data. Missing data (locations/hashtags) are usually changed to Not Available as these data fields are not necessary for users of twitter to input. Although saying that, there are a huge number of inconsistent data.
Especially since the introduction of emojis, one would think that sentiment analysis would be easier based on emoji recognition, in fact the opposite is the case. The majority of social media users use emojis for sarcastic purposes or in irony defeating the purpose of emoticon analysis.
#HappyEmoticons
emoticons_happy = set([
    ':-)', ':)', ';)', ':o)', ':]', ':3', ':c)', ':>', '=]', '8)', '=)', ':}',
   ':^)', ':-D', ':D', '8-D', '8D', 'x-D', 'xD', 'X-D', 'XD', '=-D', '=D',
    '=-3', '=3', ':-))', ":'-)", ":')", ':*', ':^*', '>:P', ':-P', ':P', 'X-P',
    'x-p', 'xp', 'XP', ':-p', ':p', '=p', ':-b', ':b', '>:)', '>;)', '>:-)',
    '<3'
    ])

# Sad Emoticons
emoticons_sad = set([
    ':L', ':-/', '>:/', ':S', '>:[', ':@', ':-(', ':[', ':-||', '=L', ':<',
    ':-[', ':-<', '=\\', '=/', '>:(', ':(', '>.<', ":'-(", ":'(", ':\\', ':-c',
    ':c', ':{', '>:\\', ';('
    ])

#Emoji patterns
emoji_pattern = re.compile("["
         u"\U0001F600-\U0001F64F"  # emoticons
         u"\U0001F300-\U0001F5FF"  # symbols & pictographs
         u"\U0001F680-\U0001F6FF"  # transport & map symbols
         u"\U0001F1E0-\U0001F1FF"  # flags (iOS)
         u"\U00002702-\U000027B0"
         u"\U000024C2-\U0001F251"
         "]+", flags=re.UNICODE)

#combine sad and happy emoticons
emoticons = emoticons_happy.union(emoticons_sad)
This code compiles all the basic emoticons used in tweets and later we will be removing these from the text we get to get a cleaner data in the form of text.
Cleaning the Data
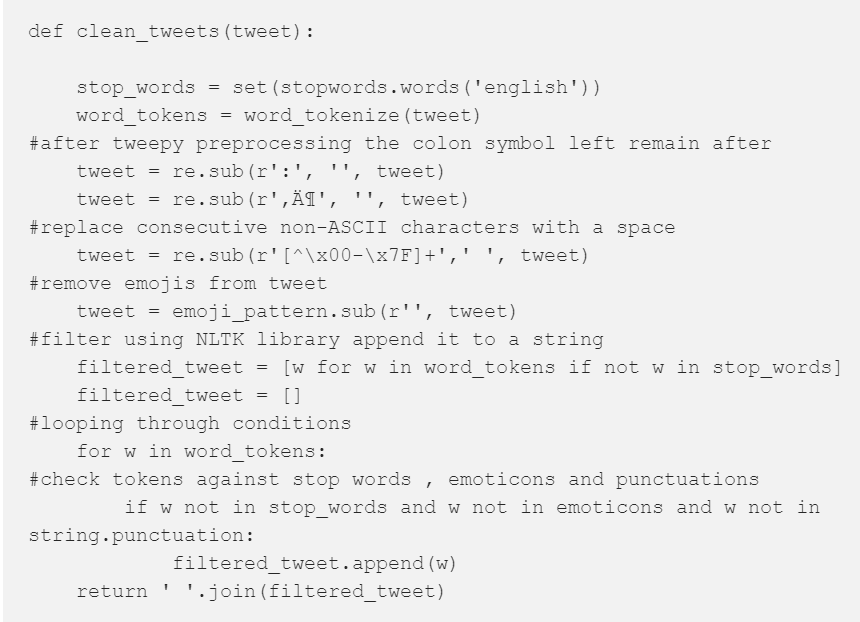
We will use the following code to clean the data of all emoticons and stop-words, all unnecessary punctuation etc.
Cleaning the text that we get from tweet via a variety of packages. As there are a number of abnormalities in the text data extracted from tweet. Earlier the developer’s code of removing emojis was shown. Now as mentioned earlier in the libraries section, Python comes with its own tweet-pre-processor library, this library automatically cleans the text. Furthermore, the developer uses a manual cleaning process as well. Initially, stop words are initiated and removed, followed by removing the emoticons and then tokenizing the entire remaining text. Re and nltk.tokenize are used to get rid of punctuations as well. I have used Mwikali Muoki’s article as a reference for this which you can find below:
African influencers: Twitter users segmentation | by Mwikali Muoki | Medium
Particularly, this set of code should work:
Once this code is implemented, the text gets cleaned. For example, a text string “This Water bottle……. looks very bright to me :D” would be reduced to “Water Bottle very bright” which helps the system analyze it sentimentally. Some other examples:

A Simple GUI to go with this system
A program is nothing without a GUI, so for this system you will make a very simple GUI, and we will be using Tkinter making it very easy to implement.
#Start of GUI
window = Tk()
#Title of Gui
window.title("Sentiment Analysis")
#multiple tabs
tab_control = ttk.Notebook(window)

tab1 = ttk.Frame(tab_control)

tab2 = ttk.Frame(tab_control)

tab_control.add(tab1, text='System')

tab_control.add(tab2, text='About')
#GUI window size
window.geometry('1000x700')
heading = Label(tab1, text="Welcome To Sentiment Analysis of tweets", font=("Arial Bold", 25))
#GUI fields position
heading.grid(column=1, row=0)
lbl = Label(tab1, text="Please enter your keyword", font=("Times New Roman", 20))
lbl.grid(column=1, row=10)
txt = Entry(tab1,width=10)

txt.grid(column=2, row=10)
prgbar = Label(tab1, text="Current status: Awaiting input from user", font=("Times New Roman", 10))
prgbar.grid(column=3,row =12)
#tab2
abt = Label(tab2,text="Welcome To Sentiment Analysis of tweets", font=("Arial Bold", 25))
abt.grid(column=1, row=0)
abt2 = Label(tab2,text="Good Day", font=("Times New Roman", 15))
abt2.grid(column=1, row=1)
abt3 = Label(tab2,text="This program takes an input of a keyword from user and extracts latest 200-250 tweets relating to the keyword.", font=("Times New Roman", 15))
abt3.grid(column=1, row=2)
abt4 = Label(tab2,text="After extraction these tweets are analyzed exploratory and sentimentally before being presented visually", font=("Times New Roman", 15))
abt4.grid(column=1, row=3)
abt5 = Label(tab2,text="For more information please contact: Name", font=("Times New Roman", 15))
abt5.grid(column=1, row=4)
abt6 = Label(tab2,text="Email: ", font=("Times New Roman", 10))
abt6.grid(column=1, row=5)


#process once the button is clicked
def clicked():
    messagebox.showinfo('Message', 'The analysis has begun')

    prgbar.configure(text="Current status: extracting tweets")
The tabs create 2 tabs in the GUI, the rest are labels and text boxes we have used. Which will make the system look something like this:

Extracting the Tweets using the Keyword from a User.
This piece of code will help us extract first the keyword from the user, and use that keyword to extract 250 of the latest tweets.
#extract keyword from user
    search_words = txt.get()

# Collect tweets
    tweets = tw.Cursor(api.search,
              q=  search_words,
              lang="en").items(250)
#print extraction of tweets
    tweets_copy = []
    for tweet in tqdm(tweets):
        tweets_copy.append(tweet)
        print(f"new tweets retrieved: {len(tweets_copy)}")
        prgbar.configure(text=f"Current status: Tweets extracted, {len(tweets_copy)}" )
Creating the pandas Data frame to Store Tweets Data.
The dataframe is very crucial step since here we will put all the tweets and store them as well as rank them sentimentally. The following is the code you will be needing:
#creation of dataframe
polarity = []
subjectivity = []
Sentiment = []
filtered_tweet = []
clean_text = []
country = []
fltr_1 = []
index = []
Sentiment_rating = []

tweets_df = pd.DataFrame()
for tweet in tqdm(tweets_copy):
    clean_text = p.clean(tweet.text)
    filtered_tweet = clean_tweets(clean_text)
    blob = TextBlob(filtered_tweet)
    Sentiment_rating = blob.sentiment
    polarity = Sentiment_rating.polarity
    #splitting 1st word
    #fltr_1 = filtered_tweet.split()[0]
    #sentiment in text output
    subjectivity = Sentiment_rating.subjectivity
    if polarity >= 0.1 and polarity <= 0.3:
        Sentiment = " slightly positive"
    elif polarity < -0.1 and polarity > -0.3:
        Sentiment = "slightly negative"
    elif polarity >= 0.3:
        Sentiment = "positive"
    elif polarity < -0.3:
        Sentiment = "negative"
    else:
        Sentiment = "neutral"
        #country name (where applicable)
    for country in pycountry.countries:
        if country.name in tweet.user.location:
            country = country.name
        else:
            country = "Not Available"
            #hashtags (where applicalble)
    hashtags = []
    try:
        for hashtag in tweet.entities["hashtags"]:
            hashtags.append(hashtag["text"])
    except:
        pass
    tweets_df = tweets_df.append(pd.DataFrame({'tweet_id': tweet.id,
                                           'tweet_location': country,
                                           'polarity': polarity,
                                           'subjectivity': subjectivity,
                                           'Sentiment': Sentiment,
                                           'date': tweet.created_at,
                                           'text': tweet.text,
                                           #'filtered_tweet': fltr_1,
                                            'filtered_tweet': filtered_tweet,
                                           'hashtags': [hashtags if hashtags else None],
                                           'source': tweet.source,
                                           'likes': tweet.favorite_count,
                                           'is_retweet': tweet.retweeted}, index=[0]))
    tweets_df.head()
I know, I know WHAT EVEN IS THIS CODE, Let me explain all the individual attributes:


Exporting the Data frame into Google Sheets.
Additionally you will also need to know how to insert dataframes into Google Sheets, Worry not! This will take just moments to do, Just follow the link below to go to Melvynn Fernandez’s Article where it is explained beautifully.
Now we do this because we want to use tableau and in order to make the whole process Real-time, we export our dataframe into Google Sheets and wait tableau to make automatic adjustments into new Data.
Remember how earlier you learned how you get service file from google sheets to implement into python? We will use that now:
#EXPORTING DATAFRAME ONTO GOOGLESHEETS
    client= pygsheets.authorize(service_file='filepath')
    lbl.configure(text="Authorized")

    sheet = client.open("fyp_tw")
    prgbar.configure(text="Current status: Sheet opened")

    wks = sheet[0]
    prgbar.configure(text="Current status: First sheet Accessed")

    wks.set_dataframe(tweets_df,(1,1))
    prgbar.configure(text="Current status: Data Updated")
Your Data into Google Sheets will look something like this:

Visualizing the Sentiment Analysis Using Tableau.
To make a Dashboard, download Tableau public and create your own dashboard as you desire connecting it to Google Sheets. You can use my dashboard as a sample:
https://public.tableau.com/views/FYPdash_16004530851980/FYPDashboard?:language=en&:display_count=y&publish=yes&:origin=viz_share_link
If you are having trouble connecting to google sheets or making the dashboard, I will attach some resources that are quite siple to follow:
Connect Google Sheets to Tableau & Joining Data — Tableau Tutorial P.1 — YouTube
Tableau for Data Science and Data Visualization — Crash Course Tutorial — YouTube
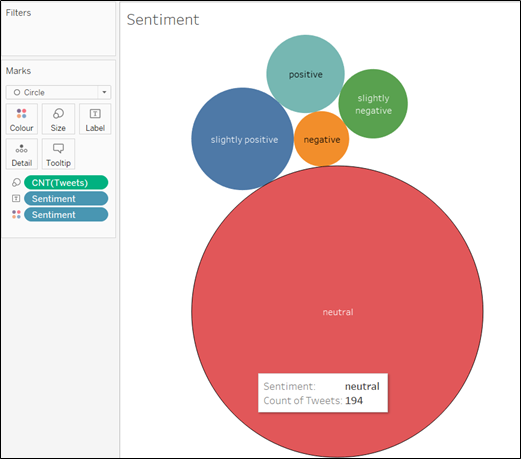
Here are some sample Visualizations you can use:

And finally
Just use the following code to close the whole system and make it work
webbrowser.open("your public tableau link")

btn = Button(tab1, text="Click Me to start Analysis", command=clicked)

btn.grid(column=3, row=10)
tab_control.pack(expand=1, fill='both')

window.mainloop()

And There you Go! Feel Free to reach out if you encounter any issues!
For More Amazing Articles & Projects, visit: DataFifty.com