
Business Intelligence Life Cycle Revolves around the concept of taking things one at a time. Similar to AI, BI has many aspects attached to it and only works well when run like a well oiled machine. In this article, we will look at the steps the need to be taken to run a proper BI model. The BI Life Cycle. To learn more about the history of Business Intelligence and its rise, visit our article on the subject here.
BI LIFE CYCLE
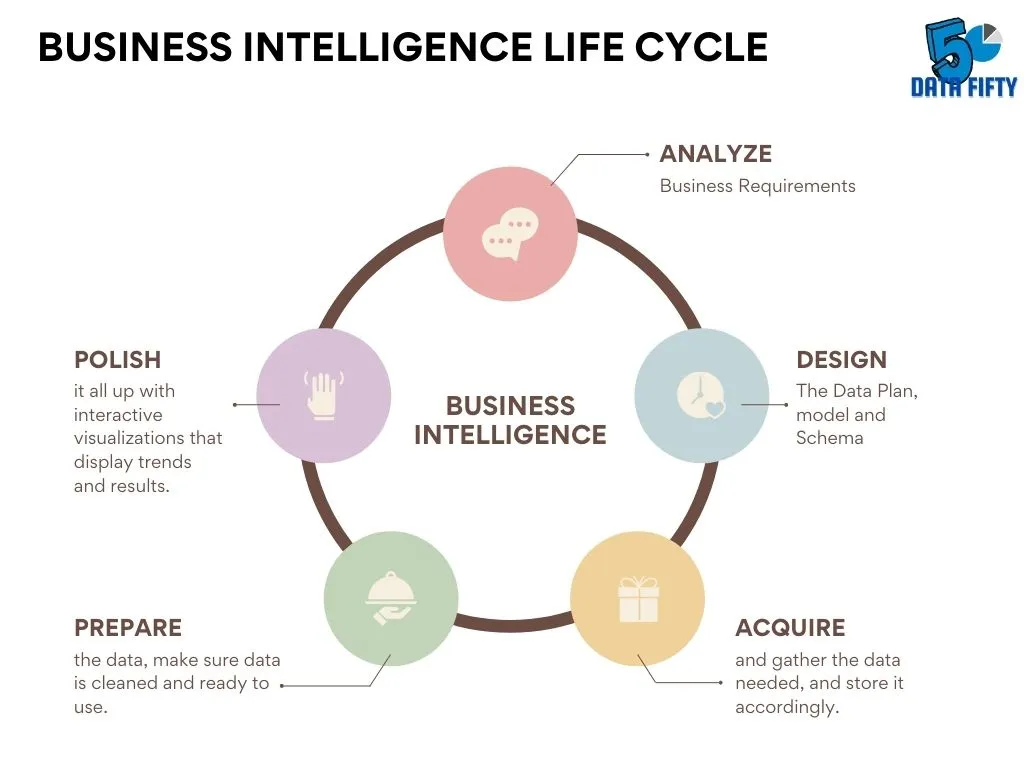
Step One- Identify The Problem
It starts with a question or problem
For example, this should be fairly universal. For example, say the problem is “need more customers”.
Step Two-Identify available data
In this example, you can see sales history, marketing automation, or CRM (Customer Relationship Management). A source that tracks movement through the marketing or sales goal-achieving process is a good source from the start.
Step Three-Prepare the data
The list of sales and customers can be useful, but at this stage you can do so-called “modeling of the data” or prepare it for use in your reports. In the sales example, there is a row in the SalesAndMarketingFactTable that you create each month for each customer in this step, showing the total number of emails sent, opened, replied, and purchased. Month or next month. This sounds a bit complicated, but it’s easier to understand with a real-world example.
Step Four-Create a report (that is, make the data clean and easy to digest)
In this step, you’ll take the data you’ve prepared and create a report that includes monthly sales and the total number of emails sent / opened / replied, as well as potential client-level reports showing monthly activity. increase. You can also use it to group customers and identify popular products and cross-selling opportunities.
Step Five – (Recommended) Check and repeat the data
We will make sure that our information provides sales or marketing with the information they need to take action. Do you need to package your product or spend a better time creating marketing emails? This allows you to dig deeper into critical areas and restart the process, or identify other data that needs to be tracked to ensure that new sales are generating sufficient margins.
Business Intelligence Maturity Model
The Concept of the Business Intelligence Maturity model was introduced by Gartner as seen below.
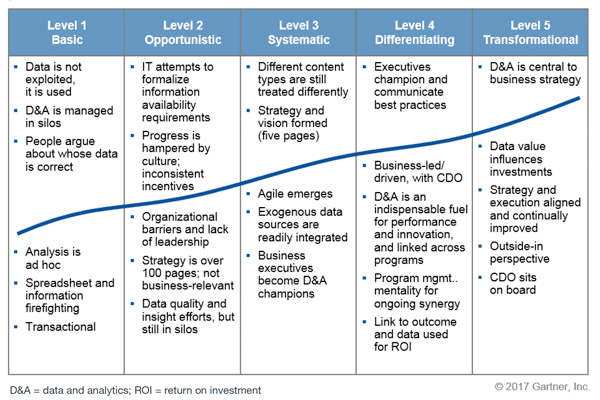
Here is a breakdown of what each level represents!
Level 1-
Starting with “Good” or “Owner Experience”, when reports are used, they are primarily created for a one-time specific purpose. They take a lot of time to create and the underlying data doesn’t make much sense, so it’s not very reliable.
Level 2 –
People / organizations at this stage are using reports and can create reports multiple times. Often, these only look at functional data areas (not operational reports, financial reports, or composite reports that display actual financial data and operational data together).
Level 3 –
Companies either reuse the report or update the report regularly with new data. These reports are key to decision making. More leadership involvement is beginning to emerge.
Level 4–
Coordination with what is considered “trustworthy data” throughout the organization. The subject matter expert (SME) owns individual datasets (accounting, operations, marketing), while senior management drives the project and ensures that the project meets the overall business goals. An example would be to secure company-wide gross profit and total assets rather than trying to sell X widgets.
Level 5 –
At this stage, you no longer use reports to explain what’s happening. Use this to predict what will happen based on knowing what happened before. Leadership may also perform “what if” analysis to produce “normative” reports that can compare the impact of different decisions. Achieving this level of BI across the enterprise requires a lot of work and concentration.
Final Thoughts!
The economy’s reliance on IT has dropped significantly, and so has its information backlog. All executive knowledge workers have access to the data that drives their business, so they are not prevented from identifying problems and opportunities.
KPIs are generally presented visually through common distribution mechanisms for rapid review by senior management. And hence it’s important that when a BI solution is given, it tells the full story!
To read more articles Regarding Data, Analytics & AI, Visit our site here.
I had this page saved a while ago but my computer crashed. I have since gotten a new one and it took me a while to find this! I also in fact like the template though.
Great post! We are linking to this particularly great article on our site. Keep up the good writing.