
Business Intelligence is what most Companies have done to take themselves to the next level. To understand your raw data and get information from it in mere seconds is the new norm. Today we look at Astrato.io, A new Visualization tool by Vizlib. Initiated in 2016, Vizlib offered visualizations for Qlik Sense. In no time, the team expanded into core products along with extensions. Now serving Thousands of users and use-cases. The amazing team of BI Experts at Vizlib have created Astrato.io, a next generation Cloud based, Intelligent Business Intelligence tool. Today we are going to Review it. With actual case study and understand what makes it stand out from others and the future of the platform! To use the Platform, Click here.

Astrato.io Interface
The entire interface and software is really easy to use and quite User Friendly. You can sign up with Google, or via your email. We would personally recommend Signing up with Google as it will allow you to connect your Google Sheets as Well.
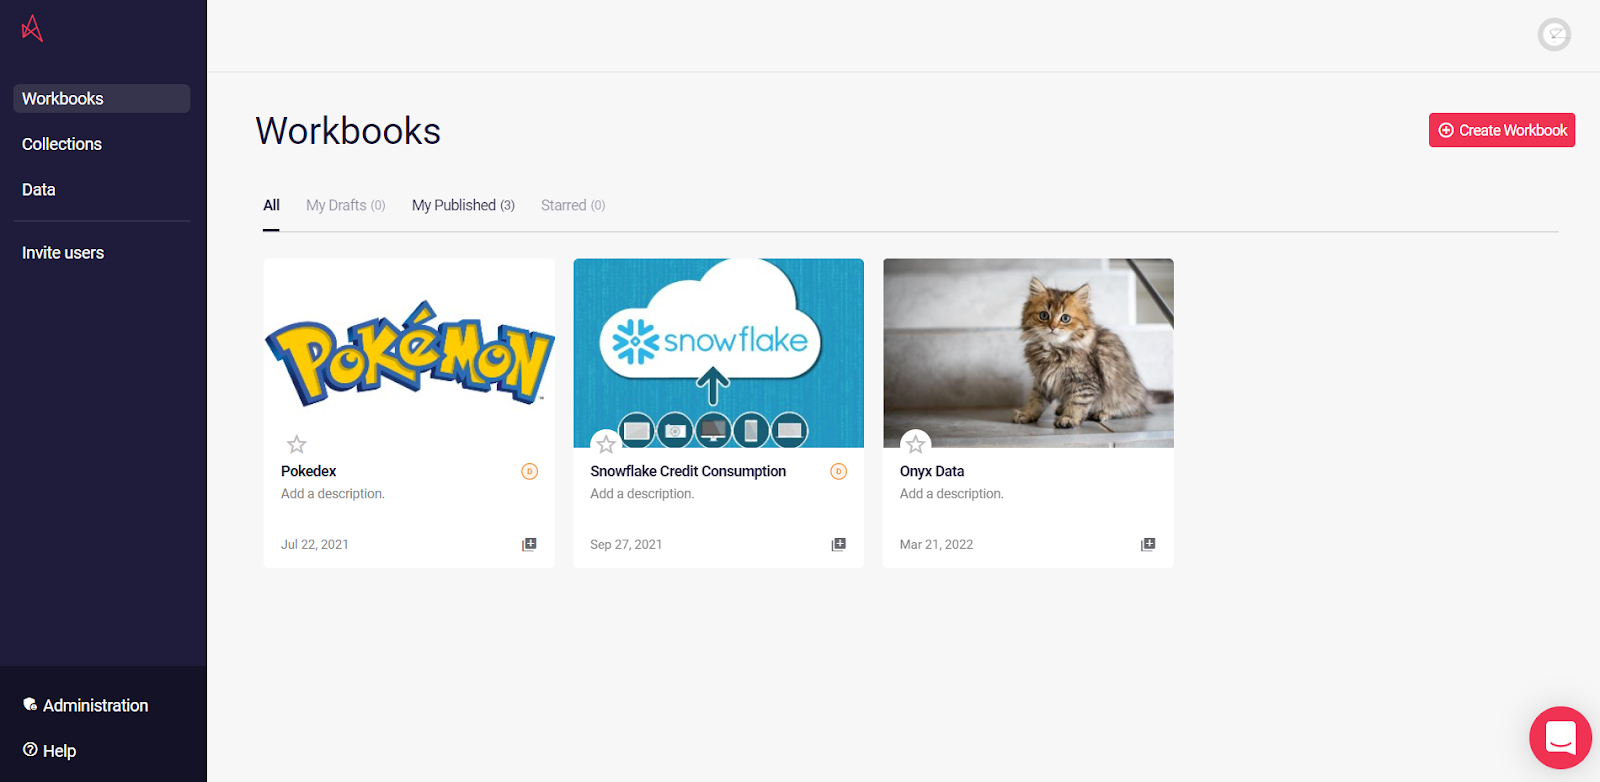
Once you log in, it is very simple to get started. Astarto.io will give you a 5-step walk through which will help you familiarize yourself with the tool. On the left we have all our Workbooks (Visualizations), Collections (Projects) & Data. Let’s move ahead and Connect our first Visualization!
Connecting Data Dimensions & Measures
For this Example, we will use Data from Onyx Data, you can download the dataset here. Once you have downloaded and uploaded the dataset into Google Sheets, we will be able to view it in our Data View on Astrato.io.
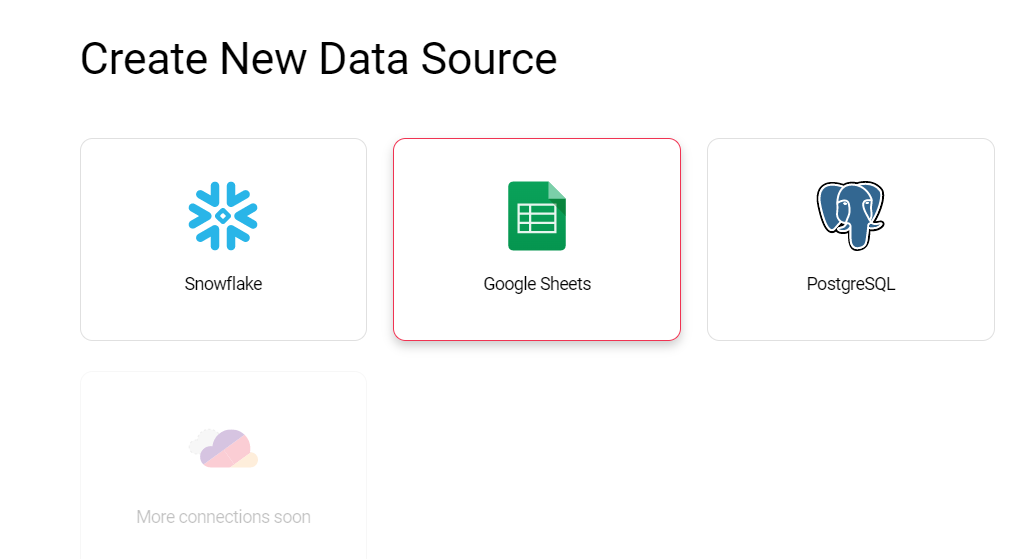
Let’s Start by clicking Create Workbook on the top Right of Our Screen. This will prompt us to select our Data Source (Data View). Then Proceed to add new Data Source from Google Sheets and select the Data Source!
Once you complete this step, the dataset explorer will pop up. You can either define your Dimensions and Measures here, or can skip this step. We recommend you add your Quantitative Qualities as Measures here so that the Astrato.io intelligent system will already have an idea how everything will eventually look like!
We will then be prompted to select a template of the visualization you wish to create. You select from the many examples here or if you already know how you wish to design, you can skip this step.

The Visualizations
If you have selected a theme, you will now see Loads of visualizations with no data. And if you skipped the last step, you will find an empty canvas. Either way, on the left bar, we will see Data Objects. Click that to see the possible Data Tools you can use.
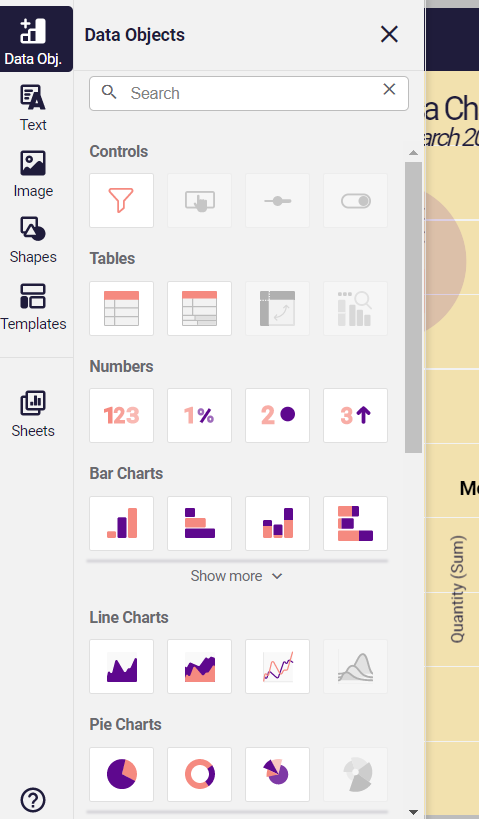
Select the Ones you wish to use. Lets take a Stacked Bar Chart For example. Once we select the Tool, we can add the data in it from the vertical bar on the right. We will add the Pie flavour and Organic field as Dimensions and we will be adding the Sum of Quantity as our Measure.
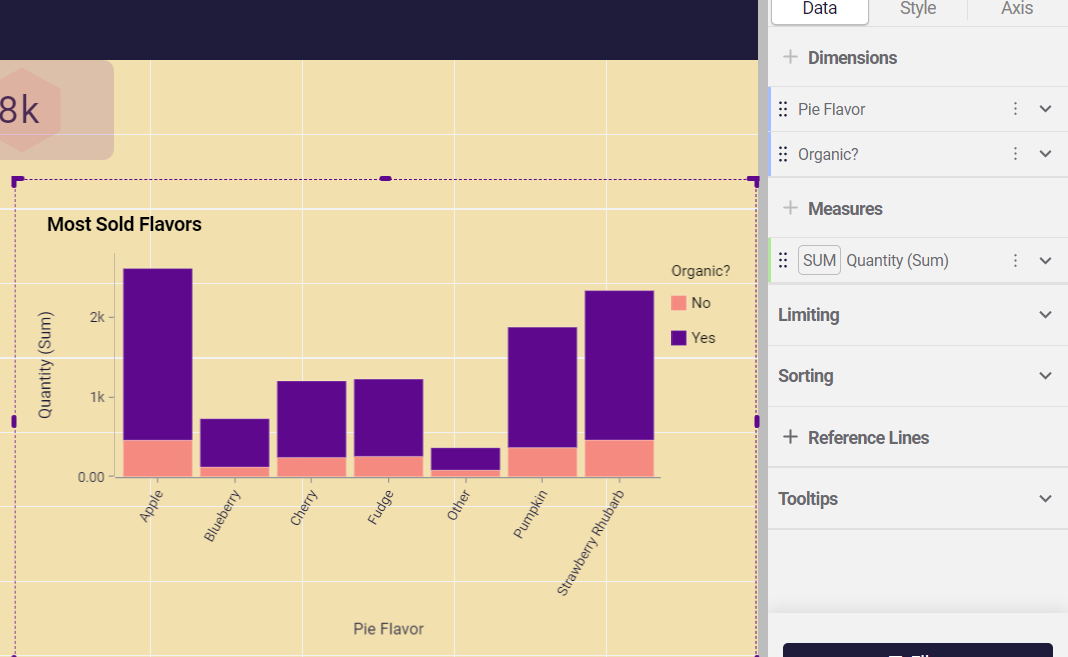
Feel free to adjust the size of the Data Object to see more Data.
In order to add Texts, Images and Shapes we can select the many given options on our navigation bar on the right side. Feel free to play around with these features. In 20 minutes, this is a sample dashboard we made:
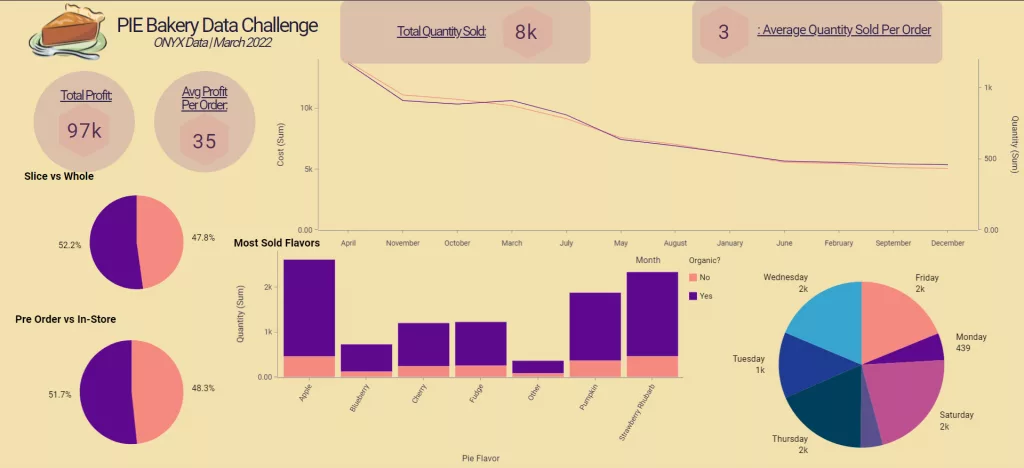
The Objects used in this are:
- Time Series Graph
- Simple Numbers
- Pie Chart
- Dynamic Pie Chart
- Stacked Bar Graph
Comment Below which of these objects are your Favorite.
Features That Stand Out
Personally, after using Astrato Analytics there are a handful of things we have noticed and are impressed by.
The interface of the Program is remarkably User-Friendly. Had to watch NO tutorials or anything. From Creating a Free account to connecting Data Sources. Everything felt like something we have been working on for ages.
The Data Objects: There were some Objects that are not that common within other BI tools. Comparison Figures, Indicators & Gauges were Very Fun to and very informative. They were literally one click away.
Cloud based integration: Cloud based BI Tools often lack one thing, Speed. Once a lot of data is given into a BI Dashboard, the responsiveness decreases. However, with Astrato this was not the case, we Put in a lot of Data to test it out, and even while creating objects we often closed our browser to check if it would be saved IT WAS!
Potential Steps in Future
Of Course, the program is relatively new to the market and still needs time to grow. There are few steps that will no-doubt grow its popularity. And we are sure the team at Vizlib is working hard towards those. A few things we would love to see are:
- More Data Source Connections: Excel, and some more SQL servers. Also would love integrations towards social platforms such as Google Analytics, Facebook ads etc. For real-time data.
- Community based Data Objects: What takes every software to the next level, its users. To allow user based developers to make custom Data Objects will be one thing that Everyone will Love!
For more Reviews, Projects and Articles, Check out Datafifty.com