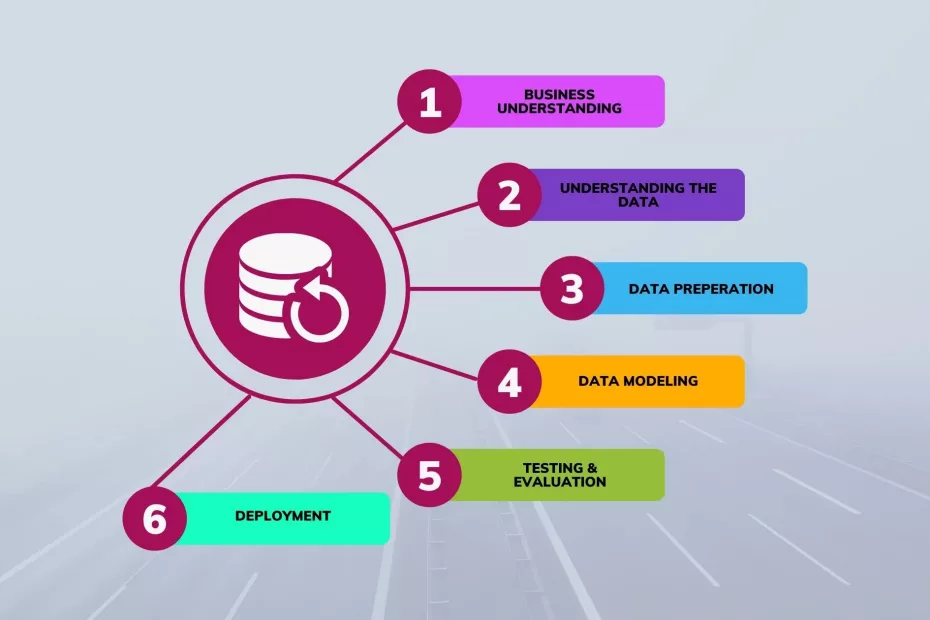
According to Merriam Webster, a methodology is defined by a body of methods, rules, and postulates employed by a discipline: a procedure or set of procedures. Methodology provides a systematic way of conducting a project because there will be a certain organized framework to rely on. Whether it is implementing Business Intelligence, CRISP DM is chosen to be the main methodology used in many data related projects. CRISP-DM stands for Cross-Industry Standard Process for Data Mining. It is widely applied in the industry for projects that are related to data mining processes in retrospect to business intelligence solutions. It is also known to be the standardized industry’s methodology. CRISP-DM contains 6 stages, which are as follows:
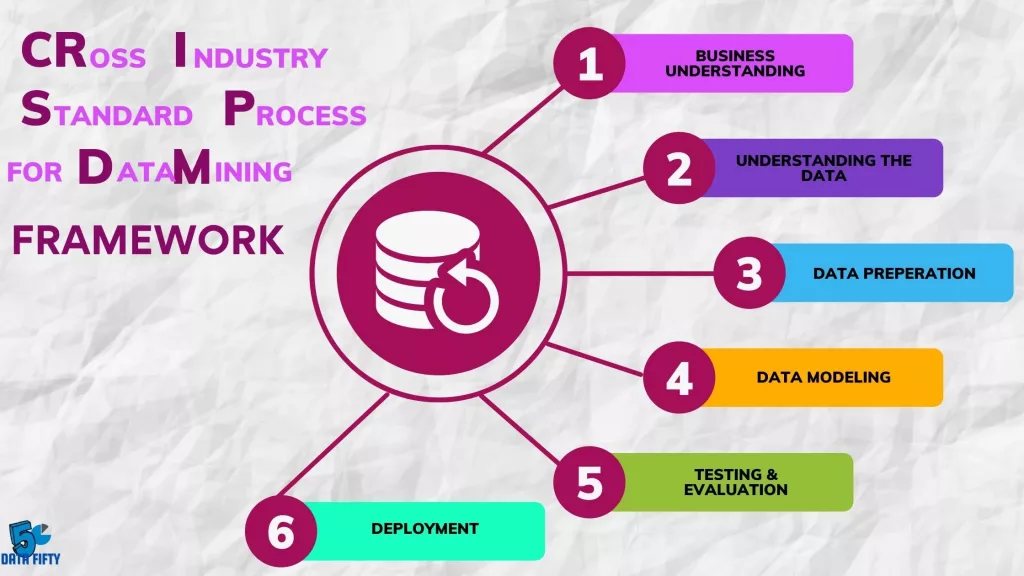
Phase 1: Business Understanding.
The first stage of the CRISP-DM process is to understand what you want to accomplish from a business perspective. Your organization may have competing objectives and constraints that must be properly balanced. The goal of this stage of the process is to uncover important factors that could influence the outcome of the project. According to this article, neglecting this step can mean that a great deal of effort is put into producing the right answers to the wrong questions.
Determine data mining goals:
In his 2006 Report, Rüdiger Wirth describes A business goal as the objectives in business terminology whereas a data mining goal states the project objectives in technical terms. For example, the business goal might be “Increase catalog sales to existing customers.” A data mining goal might be “Predict how many widgets a customer will buy, given their purchases over the past three years, demographic information (age, salary, city, etc.), and the price of the item.”
Have a project plan:
In this part one could deduce the stages in respect to the problems and the duration as well as the resources required should be outlined,
Phase 2: Data Understanding.
The second stage of the CRISP-DM process requires us to acquire the data listed in the project resources. In this case the data has a central repository. This initial collection includes data loading, if this is necessary for data understanding.
Describe data
Describe the data that has been acquired including its format, its quantity (for example, the number of records and fields in each table), the identities of the fields and any other surface features which have been discovered. Evaluate whether the data acquired satisfies your requirements.
Explore data
During this stage you’ll address data mining questions using querying, data visualization and reporting techniques. These may include:
- Distribution of key attributes (for example, the target attribute of a prediction task)
- Relationships between pairs or small numbers of attributes
- Results of simple aggregations
- Properties of significant sub-populations
- Simple statistical analyses
Mr Shafique Umar backs this in the 2014 volume of International Journal of Innovation and Scientific Research and tells us that these analyses may directly address our data mining goals. They may also contribute to or refine the data description and quality reports, and feed into the transformation and other data preparation steps needed for further analysis.
Verify data quality
Examine the quality of the data, addressing questions such as:
- Does the data look complete (does it cover all the cases required)?
- Is it correct, or does it contain errors and, if there are errors, how common are they?
- Are there missing values in the data? If so, how are they represented, where do they occur, and how common are they?
Phase 3: Data Preparation.
This stage is one of the most crucial stages in CRISP-DM methodology. This is because selected data from the previous stage will be prepared into forms that are suitable and standardized to enable data mining algorithms to perform efficiently. The quality of the data can be enhanced after going through several key tasks in this stage. Here, the data is consolidated, cleansed, transformed and reduced. It covers around 60-70% of the total project timeline as there will be numerous factors that will need to be handled such as integration of data source, duplicated records and many more.
Data consolidation
In the third stage of the project, it is necessary for you to decide which information you are going to use for the evaluation process. During this stage of your data mining project, you should set the criteria based on relevance of the available data to your goals, technical constraints like limits on the volume of data, data types and the quality of information at your disposal. You should remember that selecting data includes choosing the records (rows) as well as attributes (columns) in a table.
Data cleaning
There will be four main issues in this stage that will need to be handled and the process of they shall be handled:
- Missing values:
- Impute using attribute mean
- Manually impute all missing values
- Ignore all missing values. This is not recommended because great information will be lost hence, patterns and trends may not be able to be sought.
- Inconsistent data: Remove all inconsistencies by converting data into a similar format.
- Duplicated values: Remove duplicate records.
Data transformation
While merging tables, two or more tables having different information on the same objects are joined together. For instance, in a retail chain, one table may contain information on the general characteristics of each store, like type of mall, floor space and so on. Another table might contain information related to the demographics of the area. One record for each of the stores is included in the tables. You can merge these tables into a new one, containing one record for each of the stores, by combining fields from the original tables. Transforming data through normalization could be one of the methods of data transformation. This is done by normalizing the range of data to a smaller range such as from 0 to 1. This is beneficial as data would be easily interpreted if it is in a smaller range.
Data reduction
It involves reducing the large amount of data into smaller sizes. Data that does not give a great impact on the business objectivity would be dropped or rejected so that it doesn’t affect the rest of the data.
Phase 4: Data Modeling.
According to IBM, as the first step in modeling, you’ll select the actual modeling technique that you’ll be using. Although you may have already selected a tool during the business understanding phase, at this stage you’ll be selecting the specific modeling technique e.g. decision-tree, or neural network generation with back propagation. If multiple techniques are applied, perform this task separately for each technique.
Phase 5: Testing and evaluation.
Previous evaluation steps dealt with factors such as the accuracy and generality of the model. During this step you’ll assess the degree to which the model meets your business objectives and seek to determine if there is some business reason why this model is deficient. Another option is to test the model(s) on test applications in the real application, if time and budget constraints permit. The evaluation phase also involves assessing any other data mining results you’ve generated. Data mining results involve models that are necessarily related to the original business objectives and all other findings that are not necessarily related to the original business objectives, but might also unveil additional challenges, information, or hints for future directions. Mr Anshul Roy posted an amazing in depth article on this over on his LinkedIn.
Phase 6: Deployment.
In the deployment stage you’ll take your evaluation results and determine a strategy for their deployment. If a general procedure has been identified to create the relevant model(s), this procedure is documented here for later deployment. It makes sense to consider the ways and means of deployment during the business understanding phase as well, because deployment is absolutely crucial to the success of the project. This is where predictive analytics really helps to improve the operational side of your business.
Monitoring and maintenance are important issues if the data mining result becomes part of the day-to-day business and its environment. The careful preparation of a maintenance strategy helps to avoid unnecessarily long periods of incorrect usage of data mining results. In order to monitor the deployment of the data mining result(s), the project needs a detailed monitoring process plan. This plan takes into account the specific type of deployment. Check out more on Deployment here.
Final Thoughts!
After Looking in depth of what this methodology is and how it is used. It can come as no surprise to us that CRISP-DM is definitely the standard practice in the industry. It overviews all aspects of data and ensures perfection throughout.
For More Similar Articles, do visit our website here.