There are a lot of different types of data visualization, including bar charts, pie charts, line graphs, and scatter plots. Each has its own advantages and disadvantages, but all are effective ways of displaying data. Bar charts are the simplest type of data visualization, and are simply bars that represent the data points. They can be effective for showing how different groups of data are related, but can be difficult to see the details. In light of short content being the new norm, Animated Bar charts, or Bar Chart race are an effective way to show the progress of entities over time.
Normal Bar Charts can be made very easily by the help of Excel, Powerpoint or any Software, but how will we make a Bar Chart Race. Follow This Tutorial as we go through some of the FREE options available.
POWER BI
While Power BI doesn’t have a built-in function to Animate Bar charts, you can get it simply from the community Visuals. Let’s go through that step-by-step.
The Data
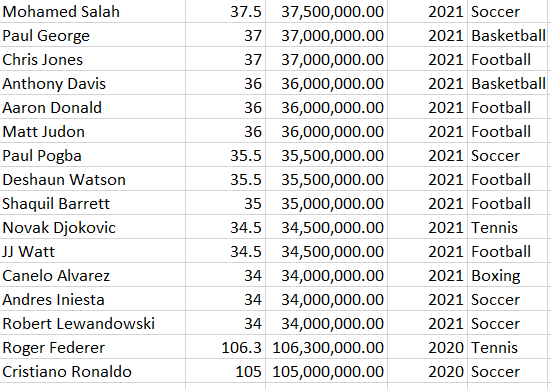
For Most of these Examples, we will use the following data which is the most paid athletes per year. You can find the dataset here.
Creating the Visualization
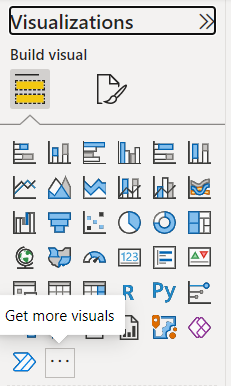
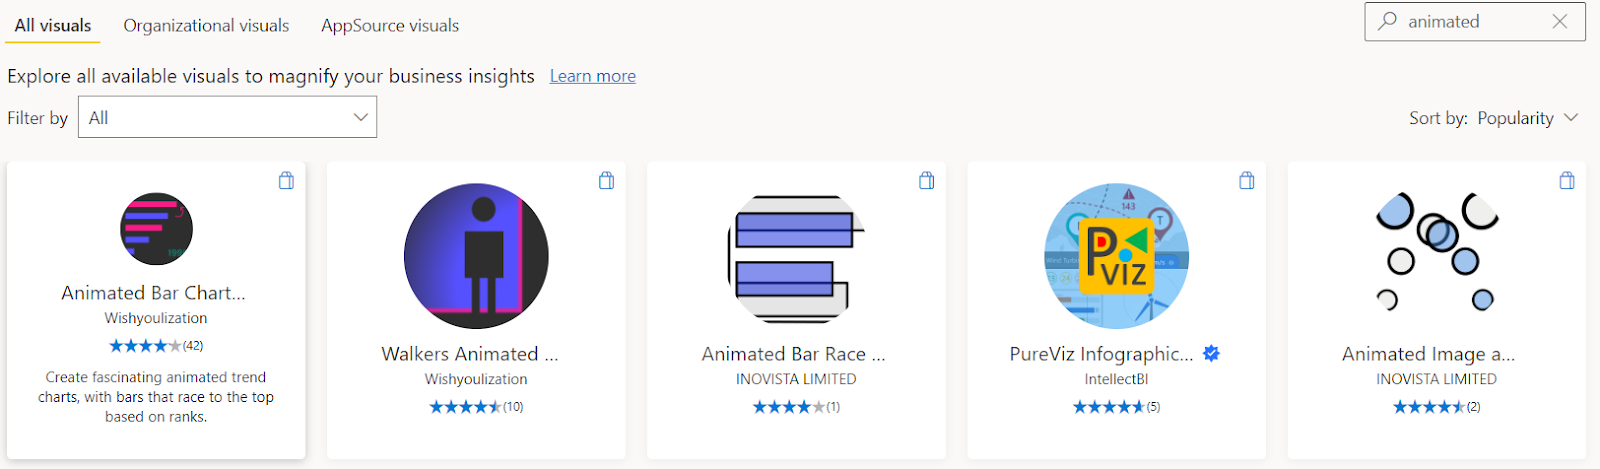
Once you load your data into Power BI, click the three dots on the right to get more visuals. Search Up “Animated Bar Chart” and Get the one by Wishyoulization.
Once the Visual is loaded onto your panel on the right, Click the icon to get started. You wil see a panel on the right for fields, Drag and drop the ones as shown in the figure below:
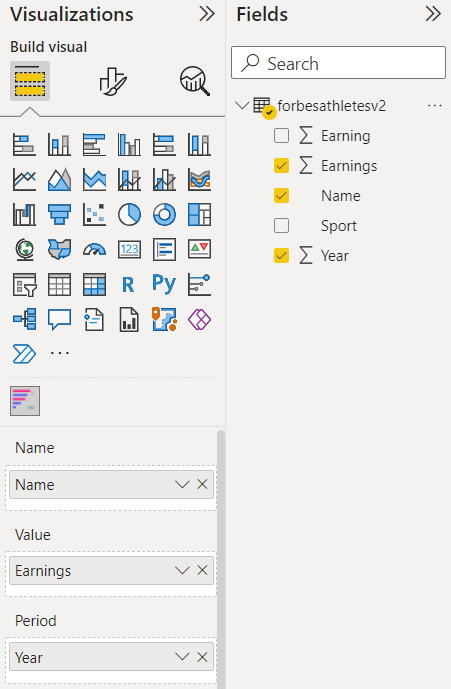
Make sure to Click the Year Period and Select Don’t Summarize. That’s it! You’ve created your bar chart race in Power BI. You can alter and play around with the setting as you like!
Flourish Studio
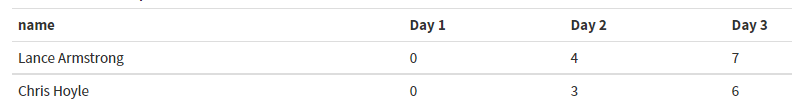
With Flourish, the data has to be formatted in a certain way. With your dataset, make sure to format your data like this:
Flourish takes care of the heavy work for us. Conveniently, Flourish has a template for creating this particular visualization.
- Open the Bar Chart Race Template using this link and click “Create Visualization”:
- In the Data tab, Click “Import your data” and select your data!
- On the Right hand side, Label your columns accordingly so Flourish can Automatically make the Visualization for you.
- Go to the Preview Tab and Voila! Your Visuals are ready! Play around with the settings to Add Headers, footers, Backgrounds, And Many More.
FabDev Bar Chart Race
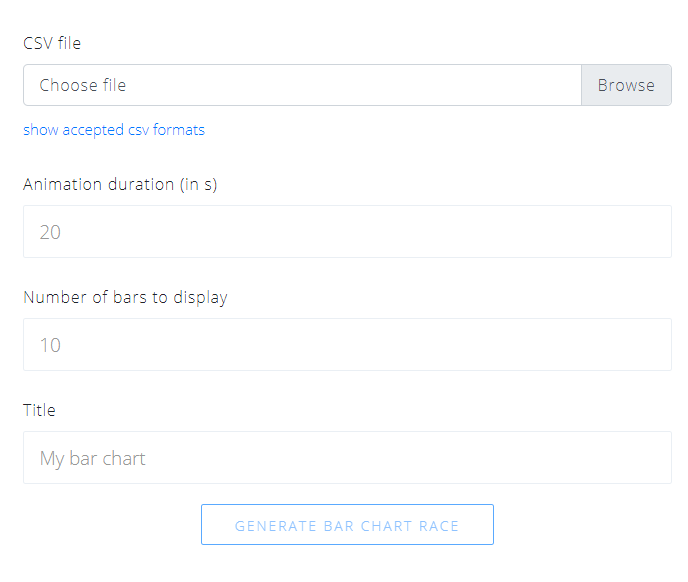
FabDev is an online hosted Github Project. The interface is Very simple and easy to use. Simply select your data, select the duration and Number of Bars. And Generate!
Tableau
Although Tableau Does not have a Built in feature or a Temmplate Set for this. With the ability to develop in Tableau we can make any Visualization Come to life. It will be very Confusing to Explain the step by step process in an article form. Abhishek on Youtube is a very talented Tableau Developer and has made a Step-by-step tutorial on it. We Recommend You View that here.
Google Data Studio
Like Power BI, Google itself doesn’t have this visual. But this is available as a community visualization.
Open DataStudio Report, import your data (Let’s take the data we used earlier as an example).
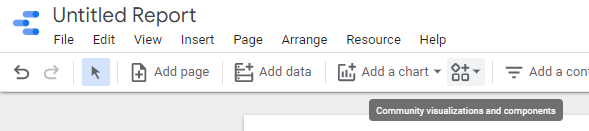
On the top bar, Click the symbol for Community Visaulizations:
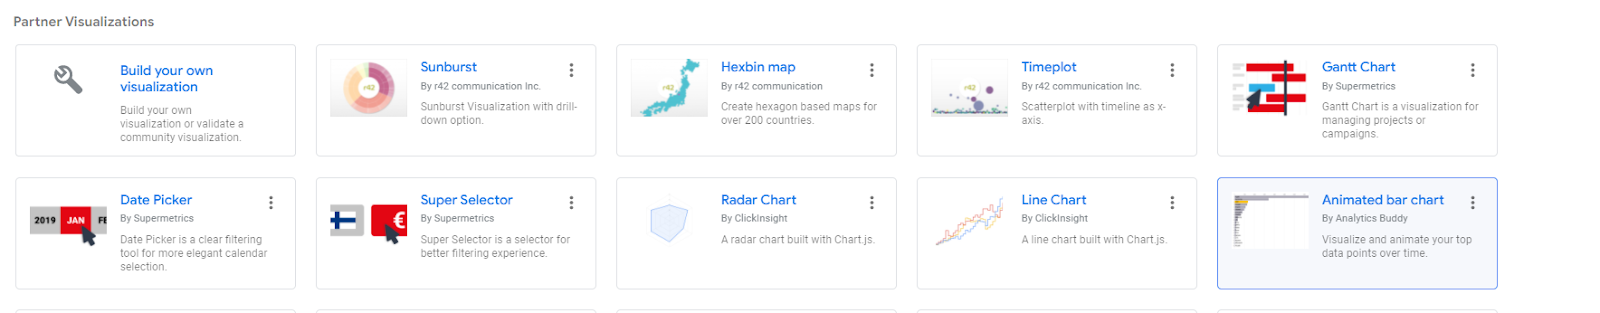
Click Explore more and Select the Animated Bar Chart:
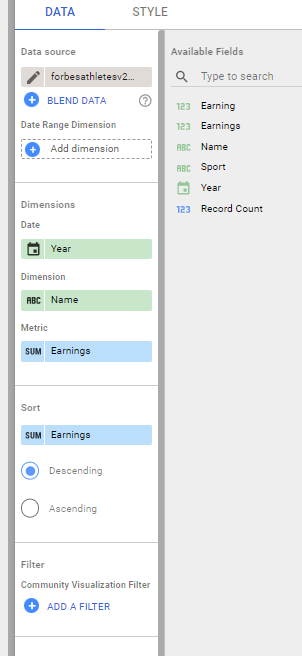
On the Right hand side, you will be able to see the Functions. Add data Accordingly.
In Terms of Bar Chart Race, Google Data Studio isn’t exactly the best option available as there aren’t many aspects you can control in it. However the Cart is created within minutes!
Final Thoughts
In terms of Functionality, we would recommend using Flourish Studio or Power BI. The options to edit you will get there are endless. We now post Visualizations Daily on Our Social Platforms (@datafifty). For More Related Articles, be Sure to visit DataFifty.